But we can also define our own procedures.
In the previous step we calculated the "exponential moving average" of a series of prices; perhaps we want to do this more than once.
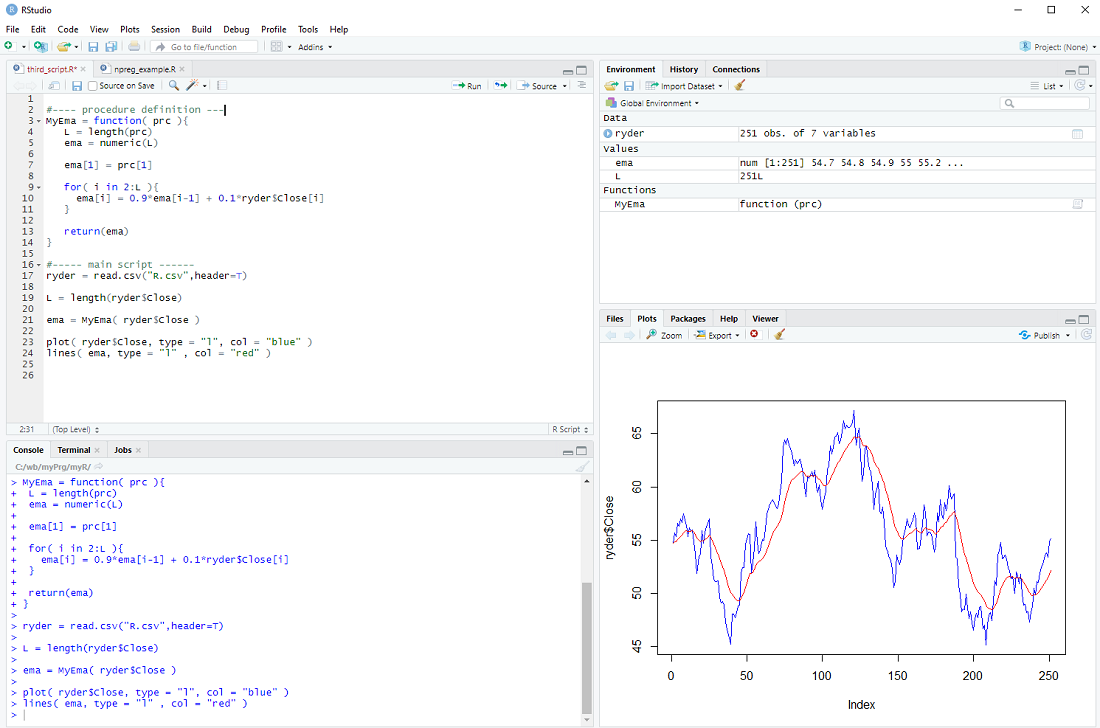
In this case it makes sense to define a procedure, which we will call MyEma
MyEma = function( prc ){
L = length(prc)
ema = numeric(L)
ema[1] = prc[1]
for( i in 2:L ){
ema[i] = 0.9*ema[i-1] + 0.1*ryder$Close[i]
}
return(ema)
}
We define our procedure MyEma to have 1 parameter, a vector of prices, then we perform the same calculation as in the previous step (you can actually copy and paste the code) and finally we return the exponential moving average vector as the result of our procedure.
In the main body of our script we can then call the procedure
ema = MyEma( ryder$Close )
with ryder$Close as the input.
If all goes well the plot should be the same as in the previous step ...
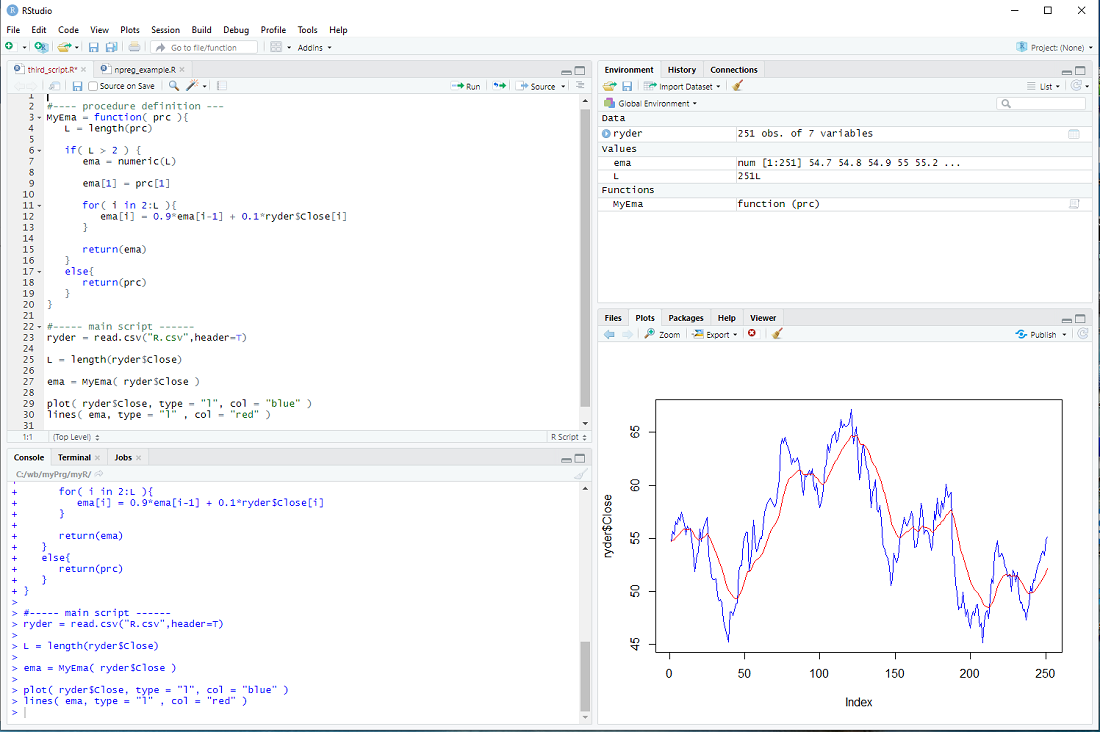
There is only one issue: The loop assumes that there is more than one element in the vector prc and the whole procedure makes little sense if there are less than 3 elements in the prc vector. We should therefore check the length L and only do the loop IF L is larger than 2, otherwise just return the prc as it is.
if( L > 2 ){
for-loop
} else{
return(prc)
}
This is depicted below.
exercise: Use a 2nd parameter w in MyEma, so that
MyEma = function( prc, w ){
and
ema[i] = (1.0 - w)*ema[i-1] + w*ryder$Close[i]
Call MyEma with different values of w and check how the plot changes
MyEma( ryder$Close, 0.1)
MyEma( ryder$Close, 0.05)
MyEma( ryder$Close, 0.2)
etc.
No comments:
Post a Comment