Let's take the data from previous steps
ryder = read.csv("R.csv",header=T)
and calculate the "trading range", normalized by the open, for every day
tRng = ( ryder$High - ryder$Low )/ ryder$Open
This generates the vector tRng , calculates the difference of high and low for every day, divided by the open and assigns the result to the elements of tRng, i.e. 251 * 2 calculations, all in one line.
We can now add this vector to the data frame ryder
ryder$TR = tRng
Now let's calculate the dollar trading volume in thousands for each day and add it as a column
ryder$dVol1000 = 0.001*ryder$Close * ryder$Volume
We can take a look at the first entries of the data frame with the head() procedure
head(ryder)
but we would see the same thing in window 3 top right.
If we want to store the expanded data frame in a file, we could do it as follows
write.csv( ryder, "Rnew.csv", row.names=F, quote=F )
I set the parameters so that it has the exact same format as R.csv.
You can get help with
help("write.csv")
The columns of ryder are: Date, Open, High, Low, Close, Adj.Close, Volume, ...
and we can access each column by its name
print( ryder$Close[3] )
But we can also access the elements of a data frame directly
print( ryder[3,5] )
The first index is the row and the second the column (Close is the 5-th column of ryder).
We can also slice data frames
df1 = ryder[100:200, ]
head( df1 )
Notice that the blank entry, instead of an index, means all columns.
df2 = ryder[ , 1:5]
head( df2 )
The blank entry, instead of an index, means all rows.
Until now, I have not mentioned the column Date and for a good reason - it is a bit of a mess.
The read.csv procedure interprets it as a Factor and not a date, although the entries are formatted so that R can interpret it as date.
But we can fix that
Dt = as.Date( ryder$Date )
ryder$Date = Dt
help("as.Date")
The as. family of conversion functions is quite useful in R.
This allows us to slice the data frame ryder in yet another way ...
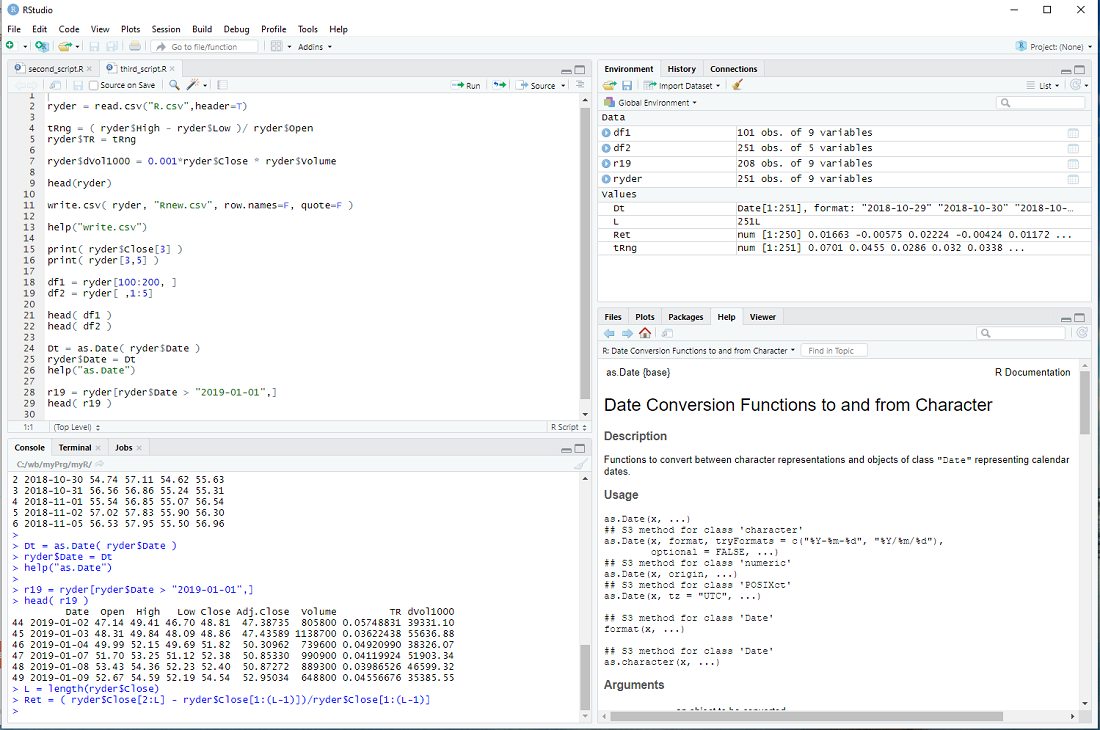
r19 = ryder[ryder$Date > "2019-01-01",]
head( r19 )
... and concludes this step of my introduction.
exercise: Calculate the returns of ryder for each day, beginning with the 2nd day.
The return on the 2nd day is ( ryder$Close[2] - ryder$Close[1] )/ryder$Close[1] ,
the return on the 3rd day is ( ryder$Close[3] - ryder$Close[2] )/ryder$Close[2] ,
etc. Now calculate it in one line and assign the results to a vector Ret.
hint: Use L = length(ryder$Close) in your calculation ...