It is not clear if this actually improves the performance of a a stock portfolio, but perhaps investors sleep better using this approach ...
There is no "exponential moving average" procedure in the R base package, but it can be easily calculated with a for-loop.
After loading the stock data file
ryder = read.csv("R.csv",header=T)
L = length(ryder$Close)
we create the vector ema
ema = numeric( L )
We set the first element of ema to the first close price
ema[1] = ryder$Close[1]
and then we calculate
ema[2] = 0.9*ema[1] + 0.1*ryder$[2]
ema[3] = 0.9*ema[2] + 0.1*ryder$[3]
.
.
.
in a loop:
for( i in 2:L ){
ema[i] = 0.9*ema[i-1] + 0.1*ryder$Close[i]
}
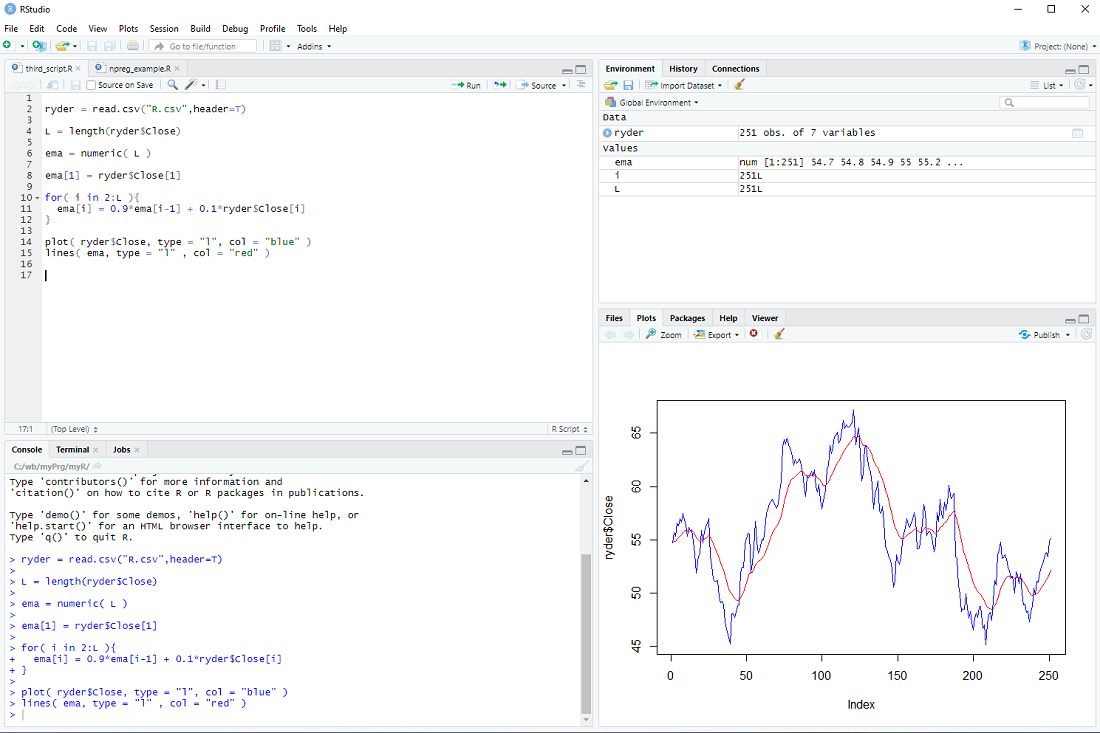
Finally, we display the prices and ema
plot( ryder$Close, type = "l", col = "blue" )
lines( ema, type = "l" , col = "red" )
At this point most tutorials would emphasize that R is an interpreted language and for-loops should be avoided at all costs.
Indeed one should use vector operations whenever possible instead of the element-by-element processing in a for loop.
However, microprocessors are so fast nowadays, that for-loops are problematic only for really large data sets imho.
exercise: Repeat the calculation, but with the volume instead of the price.
No comments:
Post a Comment