In previous blog posts I presented an introduction to R in eight steps:
step 1: Installation of R and RStudio.
step 2: Set working directory and load data.
step 3: Variables and data types.
step 4: Vector slices and linear regression.
step 5: Vector arithmetic and data frames.
step 6: for loops
step 7: Define a procedure and use if ... else.
step 8: Install packages and use external libraries.
I called it "My introduction ..." because it emphasizes what I find important and interesting in R, rather than a tutorial of R as just another programming language.
Perhaps R is an acquired taste, but it has become one of my preferred tools to understand the world ...
My introduction to R - step 8
R is open source and many people have contributed and continue to contribute procedures, libraries and packages - and we have access to all of them.
Perhaps we want to take a look at kernel regression, one of many machine learning methods.
Wikipedia even has a script for us.
In order to try out the procedure npreg(), we install the package np and open its library of procedures
install.packages("np")
library("np")
Instead of using the procedure install.packages() one can also select Tools > Install Packages ... from the RStudio menu.
We then load the data we want to examine
ryder = read.csv("R.csv",header=T)
In this example, we try to explain the volume (in thousand shares) from the high - low range
y = 0.0001*ryder$Volume
x = ryder$High - ryder$Low
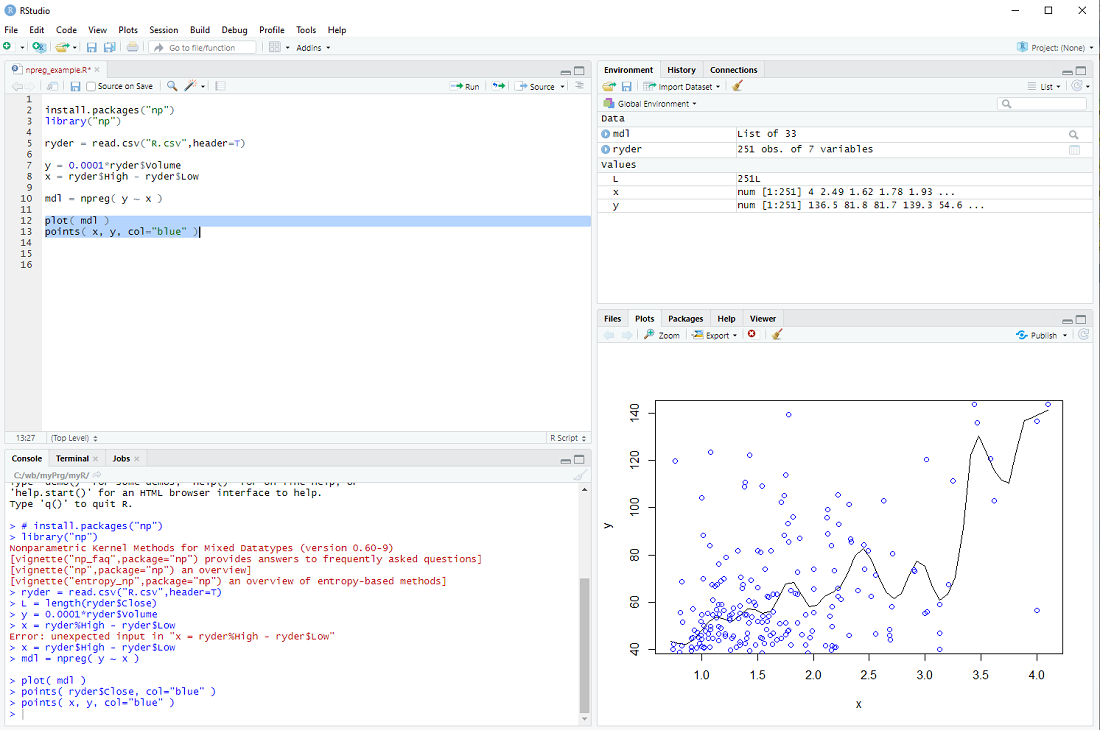
Now we can build the non-parmateric model
mdl = npreg( y ~ x )
and display it together with the data points
plot( mdl )
points( x, y, col="blue" )
exercise: Put the cursor next to the npreg procedure and hit F1 to get the help file. This tells us that npreg uses the parameter bws to set the bandwith (we just used a default). Use the procedure npregbw() to calculate the bandwith before calling npreg.
Hint: There are examples at the end of the helpfile ...
Perhaps we want to take a look at kernel regression, one of many machine learning methods.
Wikipedia even has a script for us.
In order to try out the procedure npreg(), we install the package np and open its library of procedures
install.packages("np")
library("np")
Instead of using the procedure install.packages() one can also select Tools > Install Packages ... from the RStudio menu.
We then load the data we want to examine
ryder = read.csv("R.csv",header=T)
In this example, we try to explain the volume (in thousand shares) from the high - low range
y = 0.0001*ryder$Volume
x = ryder$High - ryder$Low
Now we can build the non-parmateric model
mdl = npreg( y ~ x )
and display it together with the data points
plot( mdl )
points( x, y, col="blue" )
exercise: Put the cursor next to the npreg procedure and hit F1 to get the help file. This tells us that npreg uses the parameter bws to set the bandwith (we just used a default). Use the procedure npregbw() to calculate the bandwith before calling npreg.
Hint: There are examples at the end of the helpfile ...
Subscribe to:
Posts (Atom)