One place which generates a lot of data is the US stock market and therefore we head over to
finance.yahoo.com
to grab some interesting free samples.
On the right hand side there is a box Quote Lookup and we enter R as the ticker symbol, which gives us price and other information for Ryder System Inc. - a company which has little to do with the R programming language.
We click on historical data, select a time period (1 year is fine), push the "Apply" button and then click on "Download Data".
Save the file R.csv to the myR folder (or wherever you like to store it).
Now it is time to start RStudio and it will probably open with the one-line script we made in the previous step.
However, we already know the_answer and we "comment out the line" by putting a # character in front of it.
R ignores comments and RStudio colors them green, they are only there for us human beings to better understand what we did and want to do ...
Before we take a look at the R.csv file, we set the "working directory" in RStudio: In the menu click on Tools and select Tools > Global Options ... and then select General (which should be the default selection anyways). Go to "Default working directory ..." and select the path to your myR folder (or wherever you stored the R.csv file) by pushing the Browse button; then hit apply and eventually this will need a restart of RStudio to take effect.
Alternatively, one can call the R procedure setwd in the R script to set that path:
setwd("c:/path/to/my/folder/myR")
Notice that R uses forward slashes, even on windows, betraying its unix heritage.
Now we are ready to load the stock data of Ryder System Inc. using the read.csv procedure:
ryder = read.csv( "R.csv", header=T )
After we execute the line with Ctrl-Enter, window 3 top right will display the variable ryder and by clicking on the arrow next to it we see more of what it contains.
This is how RStudion looks at this point:
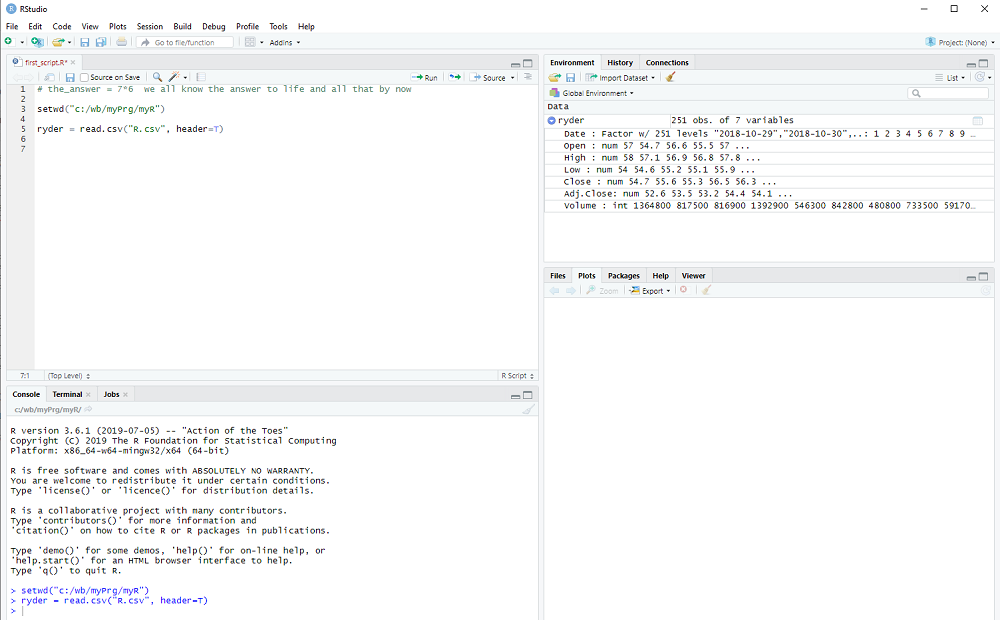
The columns that we saw on the Yahoo webpage are all there: Date, Open, High, ...
R tells us what type they are, num for decimal number, int for integers, etc. and shows us some examples.
In other words, read.csv converts the comma separated values (aha, this is what csv stands for) of the file into a collection of variables, which is called dataframe in R.
We can access each column in the dataframe using its name and the $ operator, e.g. ryder$Close
This works, because we used header=T in the read.csv procedure (T stands for TRUE).
If the data comes in a different file format, e.g. variables separated by tabs is popular, the read.table procedure might be used to import data into R.
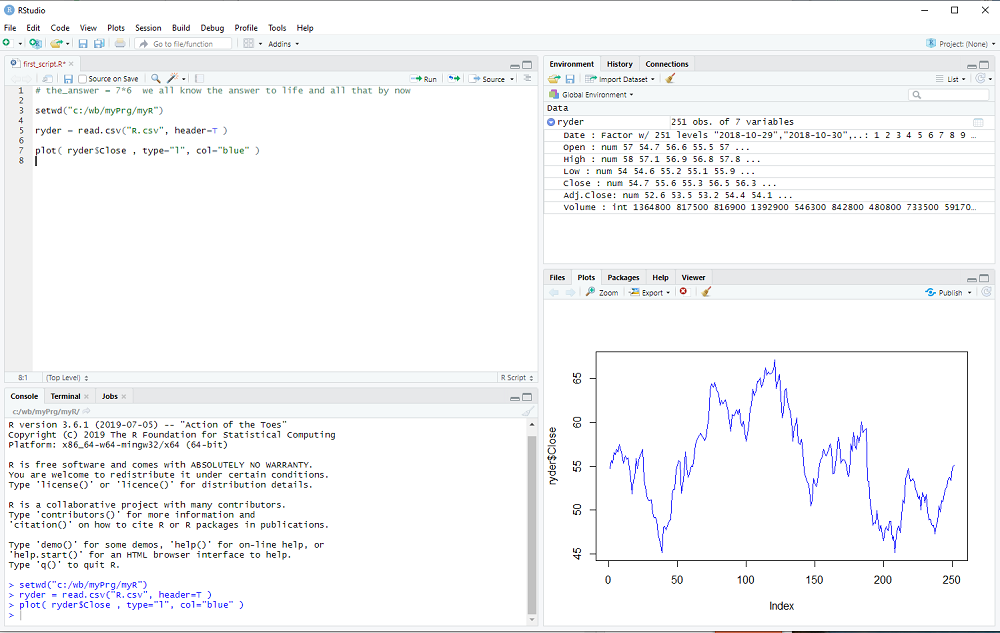
We will now take a first look at the data using the plot procedure:
plot( ryder$Close, type="l", col="blue" )
You may notice that a window popped up, listing the available columns in ryder while you typed. You can use that window to select Close without further typing.
RStudio now looks like this:
This concludes the 2nd step of my introduction. Don't forget to save your R script with File > Save in the menubar.
exercise: Click on the line with the plot procedure and then hit F1. The help text for the plot procedure should appear in window 4, bottom right.
Try different types and colors with your plot ...
No comments:
Post a Comment